
Bay Area Is Now the World's No. 2 Metro Economy
Our 2025 estimate puts the Bay Area at $1.521T, ahead of Los Angeles at $1.488T, making it the world's second-largest metro economy.
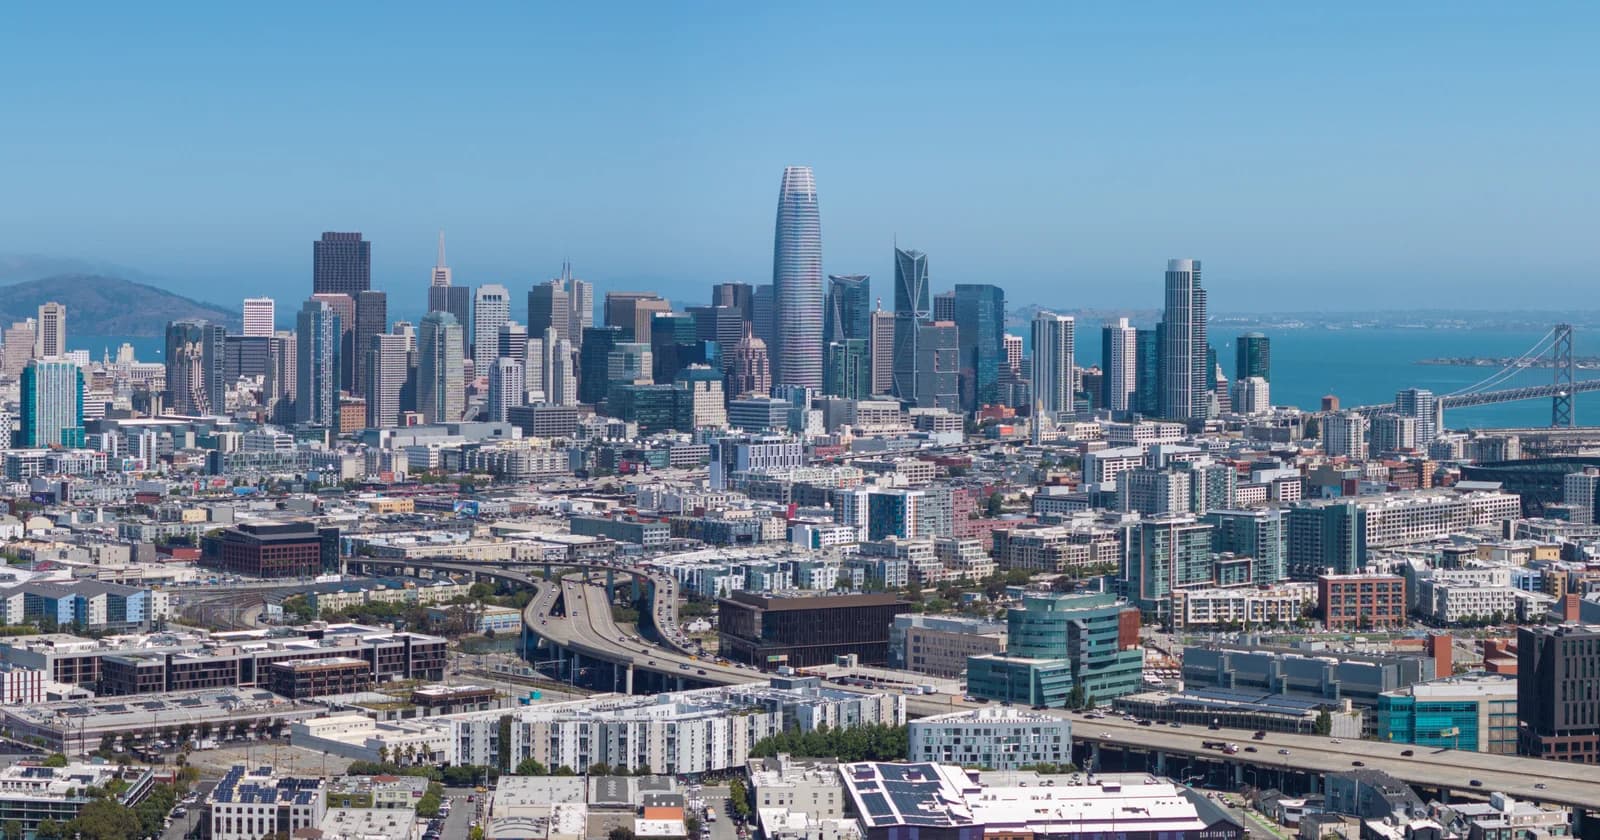
The San Francisco Bay Area became the world's second-largest metropolitan economy in 2025, according to the SF Bay Area Times estimate. We place the region's nominal gross domestic product at $1.521 trillion, ahead of Greater Los Angeles at $1.488 trillion and behind only New York.
The estimated lead is about $33 billion. It marks the completion of a decade-long economic crossover: Los Angeles led by $138 billion in 2015, the gap narrowed to $16 billion in 2024, and the Bay Area's faster 2025 growth moved it into second place.
Official 2025 county GDP will be released by the U.S. Bureau of Economic Analysis on December 2, 2026. Until then, the 2025 totals are estimates built from the latest complete county accounts, official 2025 industry data, and full-year company results. The direction of the estimate is clear because the starting gap was exceptionally small and the Bay Area's highest-value industries grew rapidly.
The 2025 estimate: Bay Area $1.521T, Los Angeles $1.488T
The latest complete BEA county data put the San Jose–San Francisco–Oakland Combined Statistical Area at $1.408 trillion in 2024. The Los Angeles–Long Beach Combined Statistical Area produced $1.424 trillion. Los Angeles entered 2025 ahead by only 1.1 percent.
Our central estimate applies 8.0 percent nominal growth to the Bay Area and 4.5 percent to Greater Los Angeles. Those rates produce the following result:
| Region | 2024 official GDP | 2025 estimated growth | 2025 estimate |
|---|---|---|---|
| San Francisco Bay Area | $1.408T | 8.0% | $1.521T |
| Greater Los Angeles | $1.424T | 4.5% | $1.488T |

The crossover required a modest growth advantage. If Los Angeles grew 4.5 percent, the Bay Area needed to grow about 5.7 percent to pass it, a difference of only 1.2 percentage points. Our estimate gives the Bay Area a 3.5-point advantage.
The result also survives a more conservative scenario. At 7.0 percent growth for the Bay Area and 5.5 percent for Los Angeles, the estimated totals become $1.507 trillion and $1.503 trillion. The Bay Area still takes second place, by about $4 billion.
Three concrete signals drove the crossover
The estimate rests on measurable 2025 growth in the industries and companies concentrated around the Bay.
First, California's information sector expanded 8.9 percent in nominal terms in 2025, based on our calculation from the BEA's state industry GDP tables. Information includes many of the software, internet, cloud, and digital-service activities that carry exceptional weight in San Francisco, San Mateo, and Santa Clara counties. California's total nominal GDP grew about 5.0 percent, so information expanded almost four percentage points faster than the state economy.
Second, Nvidia's fiscal 2026 results captured the scale of the AI infrastructure boom centered in Santa Clara. Nvidia reported revenue of $215.9 billion, up 65 percent, and operating income of $130.4 billion, up 60 percent. Data Center revenue rose 68 percent to $193.7 billion, while Data Center networking revenue rose 142 percent. Nvidia's suppliers, engineers, professional-service firms, and local spending connect that expansion to a much broader regional production network.
Third, Meta's full-year 2025 results showed another major Peninsula company expanding far faster than the general economy. Meta reported revenue of $201.0 billion, up 22 percent, and operating income of $83.3 billion, up 20 percent.
Company revenue and regional GDP measure different things, so the company totals are evidence of growth rather than dollar-for-dollar additions to Bay Area GDP. The relevant signal is the speed and scale of expansion inside the region's most productive business cluster. Semiconductor design, AI computing, advertising technology, cloud services, and software all strengthened during the year in which the Bay Area needed only a small advantage to pass Los Angeles.
The broader state data point in the same direction. California wholesale-trade output rose 11.5 percent in nominal terms in 2025, education and health services rose 8.4 percent, finance and real estate rose 4.9 percent, and professional and business services rose 4.8 percent. The Bay Area combines all of those sectors with the state's deepest concentration of high-growth information and technology activity.
A decade-long catch-up reached the finish line
The 2025 crossover is the latest step in a long trend. Applying today's combined-area boundaries consistently, Bay Area GDP rose from about $800 billion in 2015 to $1.408 trillion in 2024, a gain of 76 percent. Greater Los Angeles rose from $938 billion to $1.424 trillion, a gain of 52 percent.
In 2015, Los Angeles was 17 percent larger. By 2024, it was 1.1 percent larger. The Bay Area closed $122 billion of the gap before the estimated crossover year began.
That history gives the 2025 result context. A region growing faster for nearly a decade arrived at the year only $16 billion behind. The additional growth required to pass Los Angeles was roughly equal to one percentage point of regional output.
Why common rankings miss the Bay Area
Many global tables list San Francisco and San Jose separately. That convention divides one connected labor and business market into multiple entries, then compares each entry with combined regions such as Greater Los Angeles or Greater Tokyo.
The Office of Management and Budget defines the San Jose–San Francisco–Oakland Combined Statistical Area as an integrated functional region. Its 13 counties are Alameda, Contra Costa, Marin, Merced, Napa, San Benito, San Francisco, San Joaquin, San Mateo, Santa Clara, Santa Cruz, Solano, and Stanislaus. The federal definition follows measurable commuting and economic links.
The region's companies also operate across those boundaries. Workers, suppliers, universities, airports, venture investors, professional services, and housing markets connect San Francisco, the Peninsula, Silicon Valley, the East Bay, and the surrounding commuter counties. Adding the county GDP figures inside the federal combined-area boundary captures that system.
The same method applied to Greater Los Angeles uses its current combined-area counties: Los Angeles, Orange, and Ventura. Consistent boundaries produce a fair comparison.
The engine is concentrated around the Bay
Three counties generate most of the region's output. Santa Clara County produced $438.5 billion in 2024, San Francisco produced $268.3 billion, and San Mateo County produced $217.0 billion. Together, they accounted for 65.6 percent of the 13-county combined area's GDP.

Santa Clara anchors the semiconductor, computing, and enterprise-software economy. San Francisco contributes finance, software, business services, health care, tourism, and a dense AI sector. San Mateo connects the two through technology headquarters, biotechnology, the airport corridor, and professional services.

The Bay Area's economic scale is distributed across San Francisco, the Peninsula, Silicon Valley, the East Bay, and surrounding commuter counties. Editorial visualization created for this analysis.
No. 2 in dollars, behind New York
The Bay Area's estimated $1.521 trillion places it behind New York and ahead of Los Angeles. It also places the region ahead of the latest published output for Greater Tokyo when converted at current exchange rates.
The Japanese Cabinet Office reports 2023 nominal output of ¥125.0 trillion for Tokyo, ¥37.3 trillion for Kanagawa, ¥25.9 trillion for Saitama, and ¥22.2 trillion for Chiba. The four-prefecture total is ¥210.4 trillion. At roughly ¥158.7 per U.S. dollar on August 21, 2026, that equals about $1.33 trillion.
Exchange rates can change the international ordering. A stronger yen would lift Tokyo's dollar total. The Bay Area–Los Angeles comparison carries greater confidence because both totals come from the same U.S. source, use the same currency, and follow the same geographic method.
The core conclusion is direct: the Bay Area's faster 2025 growth carried it past Los Angeles and into the No. 2 position among the world's metropolitan economies. The official county release will replace the estimate in December. The evidence available today puts the Bay Area at $1.52 trillion, Los Angeles at $1.49 trillion, and the crossover in 2025.
Methodology and sources
- The 2024 base uses BEA CAGDP2 county GDP data, current dollars, released February 5, 2026.
- The 2025 industry calculations use the BEA SAGDP state GDP tables.
- Regional boundaries use OMB Bulletin 23-01.
- The 2025 central estimate applies 8.0 percent nominal growth to the Bay Area and 4.5 percent to Greater Los Angeles. The sensitivity case uses 7.0 percent and 5.5 percent.
- Greater Tokyo uses the Japanese Cabinet Office 2023 prefectural accounts.
- Currency conversion uses the ECB reference rates for August 21, 2026.
Cover photo: “San Francisco Downtown Aerial, August 2025” by Spicypepper999, released under CC0 via Wikimedia Commons.